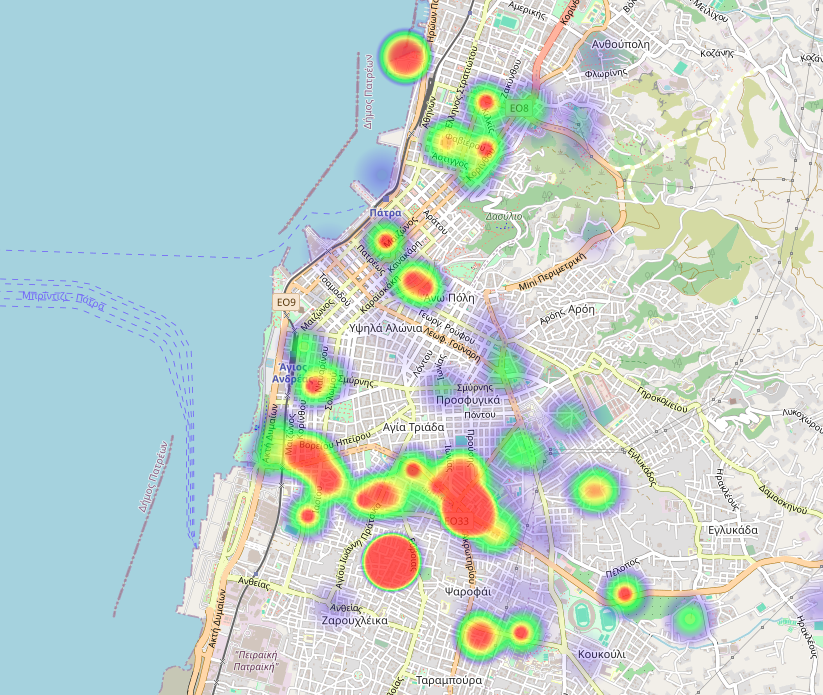
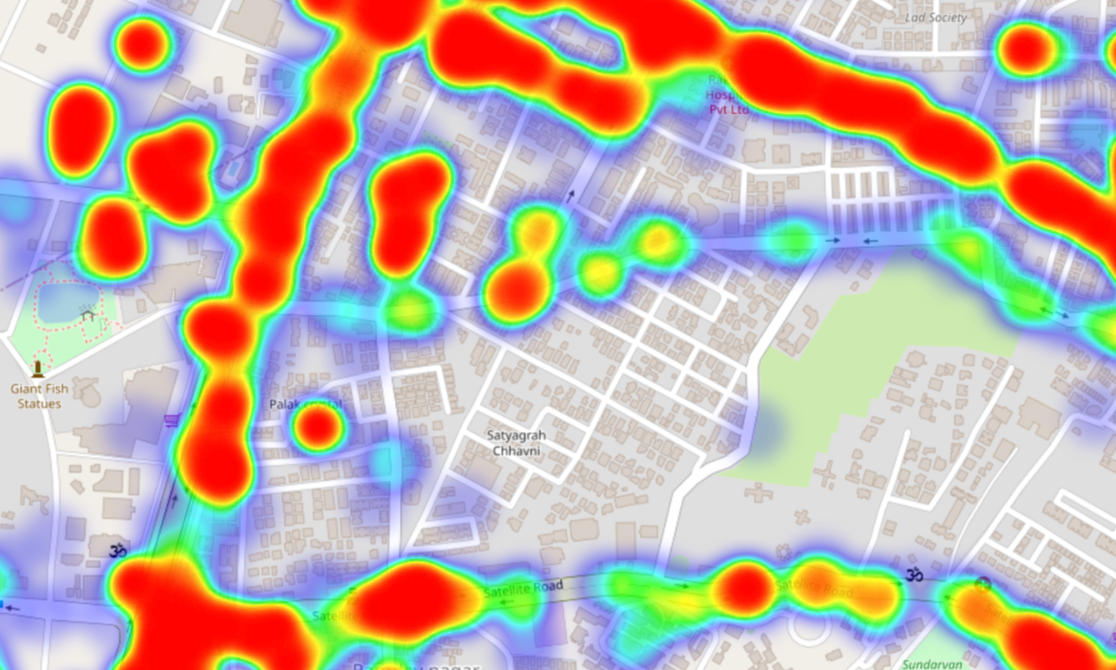
Description: An interactive heatmap
visualization using real-time data. The heatmap dynamically
represents various data metrics, such as population density, temperature variations, or
traffic patterns, over a specific geographic area. By integrating live data feeds, the
heatmap provides an up-to-date visual representation, allowing users to identify
trends, congestion, and patterns effectively. The project leverages modern web
technologies and data visualization libraries to ensure an intuitive and responsive user
experience.